Introducing Northern Latitudes: A Series on Maps and Mapmaking
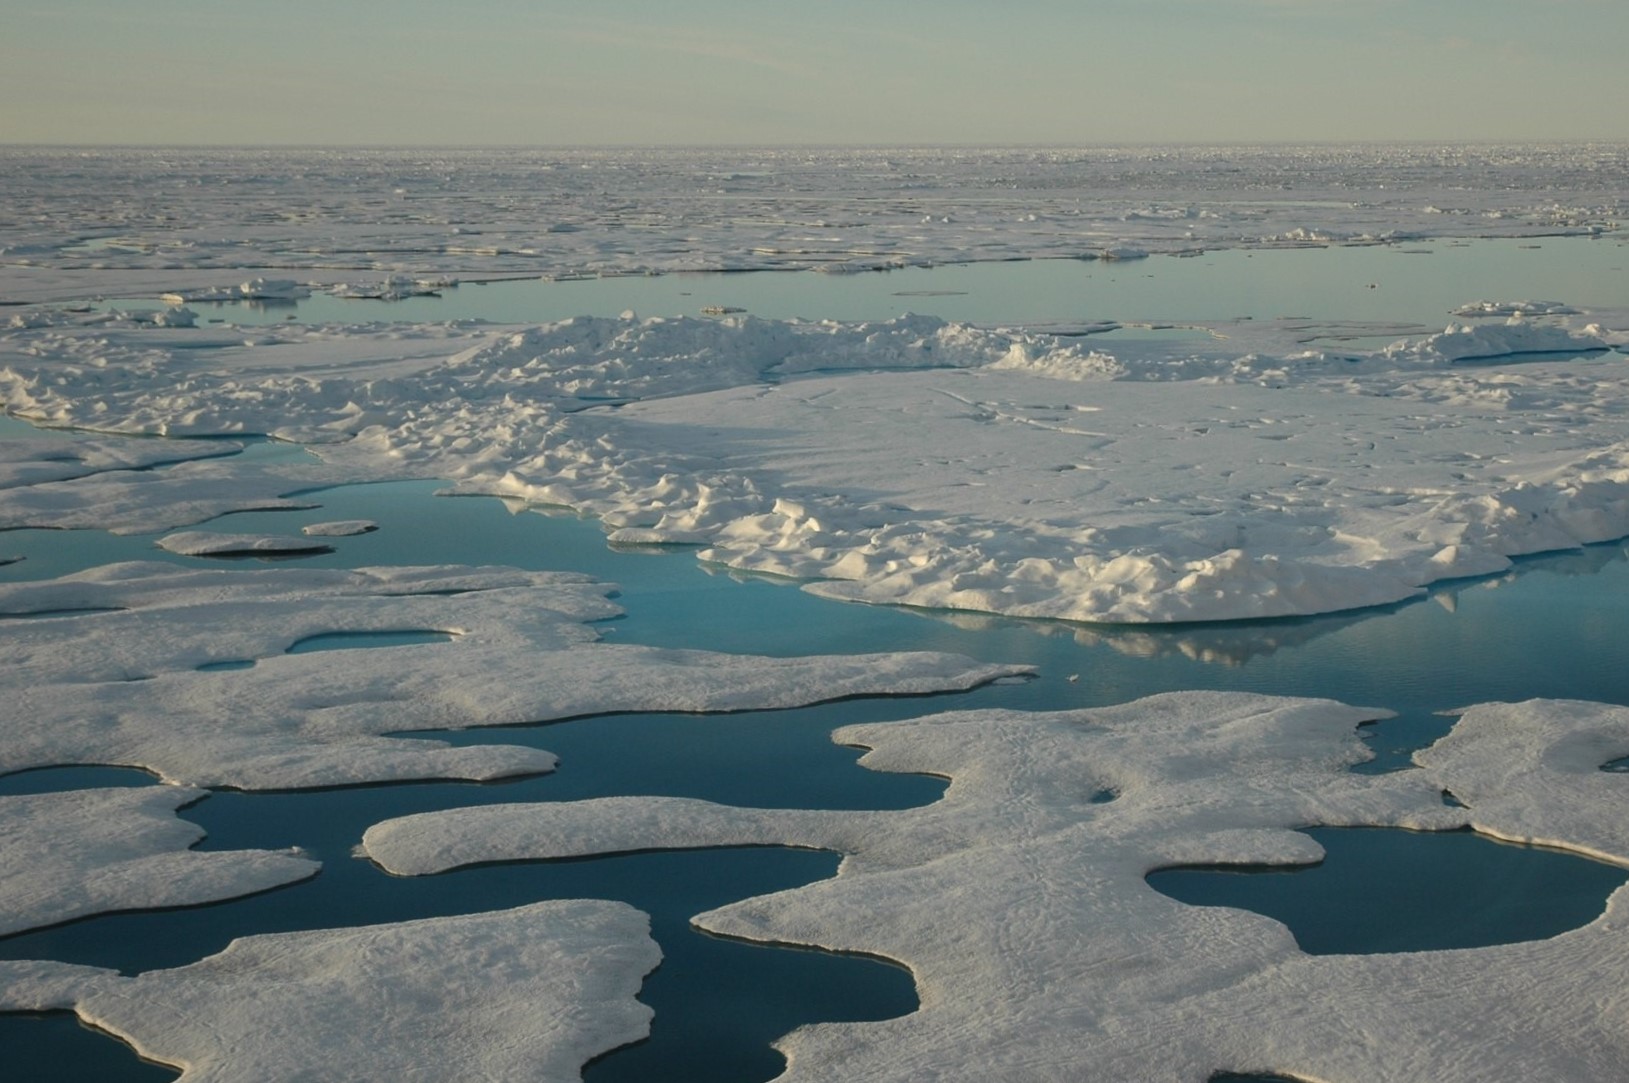
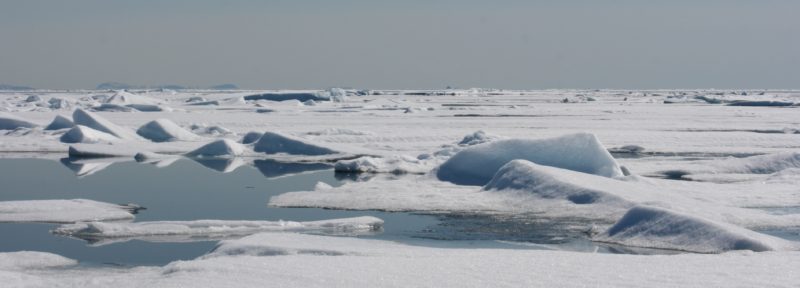
A seemingly endless landscape of ice, sea, and meltwater in the Arctic Ocean's Canada Basin.
Credit: Jeremy Potter NOAA/OAR/OER
Welcome to Northern Latitudes, a new series where we feature topical maps from our Arctic Marine Atlas and elsewhere, with a peek behind the scenes into how they are made.
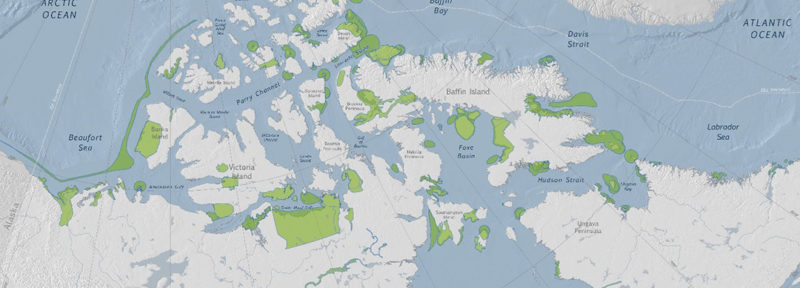
The focus today is on two maps from our Arctic Marine Atlas: one map that illustrates polynyas and another showing phytoplankton blooms.
Polynyas are areas of water that remain open even when surrounded by sea ice. Flaw leads are also areas of open water that form between sea ice that is attached to land and the moving pack ice. Polynyas and flaw leads don’t freeze over because of factors such as the upwelling of warmer waters in the area or because winds or currents continue to move ice from that region.
Polynyas and flaw leads are very important for Arctic wildlife as they create a meeting point between the ocean and the atmosphere. They allow sunlight to penetrate the depths of the water column, unimpeded by sea ice. This allows for large blooms of phytoplankton — microscopic organisms that, like plants, depend on carbon dioxide, sunlight and other nutrients to photosynthesize and create food for themselves. Zooplankton and other marine species feed on phytoplankton, forming the basis of the marine food web. Because of this, polynyas and flaw leads are some of the most biologically active regions in the Arctic Ocean. Marine mammals, fish and seabirds gather in these places to feed. Northern communities rely on polynyas and flaw leads as important habitat for hunting and harvesting. The largest polynya in the Canadian Arctic is Pikialasorsuaq, an area of great significance to Inuit communities in both Canada and Greenland.
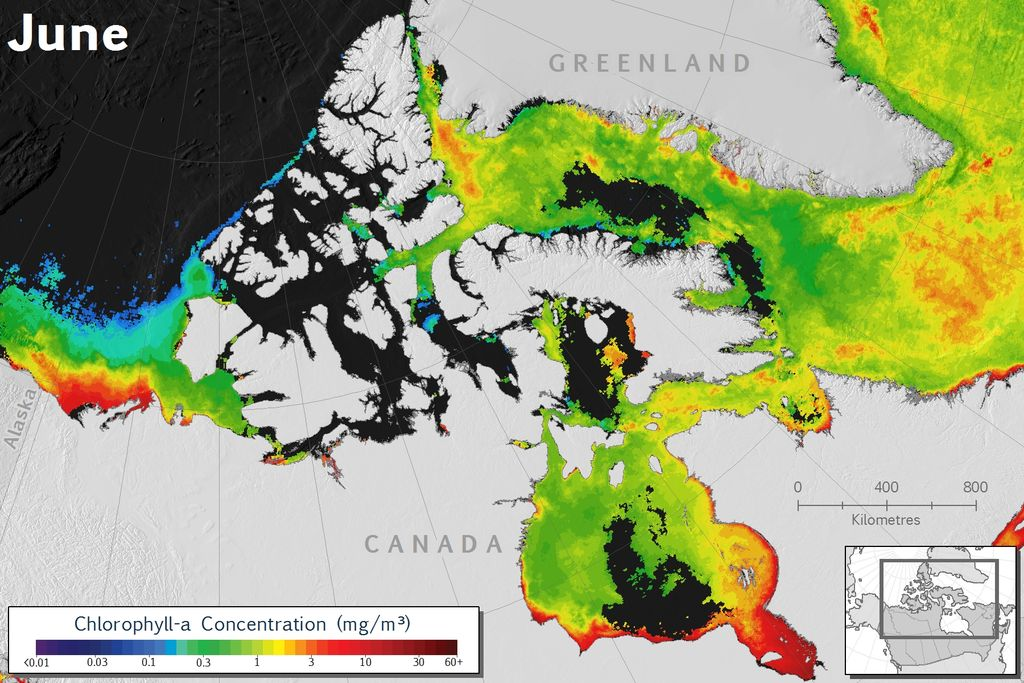
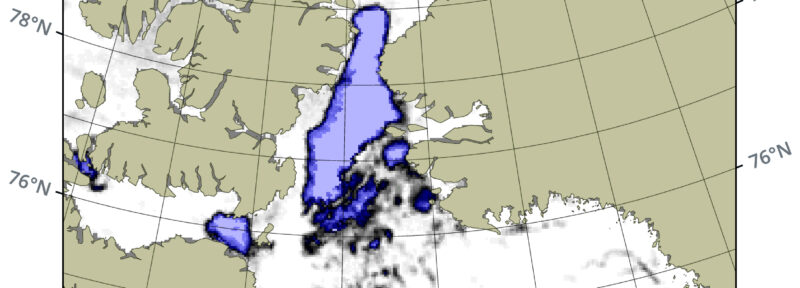
Take a closer look at the polynya and flaw leads map from our Atlas. Compare it to the monthly Chlorophyll-a map for June. In this case, the concentration of chlorophyll-a, a pigment used by phytoplankton for photosynthesis, also reflects the concentration of phytoplankton. Notice how the areas of persistent open water correspond with the first places where phytoplankton blooms during the Arctic spring and summer.
Credit: Oceans North
How did we make these maps?
The chlorophyll-a concentration data used in our map is from NASA’s OceanColor Project. Phytoplankton use chlorophyll pigments to absorb the sunlight needed to photosynthesize. Through the process of photosynthesis, phytoplankton use the energy from the sun, along with dissolved carbon dioxide, to produce the sugars that fuel them and also create oxygen as a by-product. Chlorophyll-a is the primary type of chlorophyll used; it reflects the green wavelengths in sunlight and absorbs all other colours. That’s why phytoplankton appear green. The greater the concentration of phytoplankton, the greener the ocean appears. These colours can even be seen from space. Using satellite imagery, scientists in NASA’s OceanColor Project can identify areas of higher ocean productivity.
Credit: Oceans North
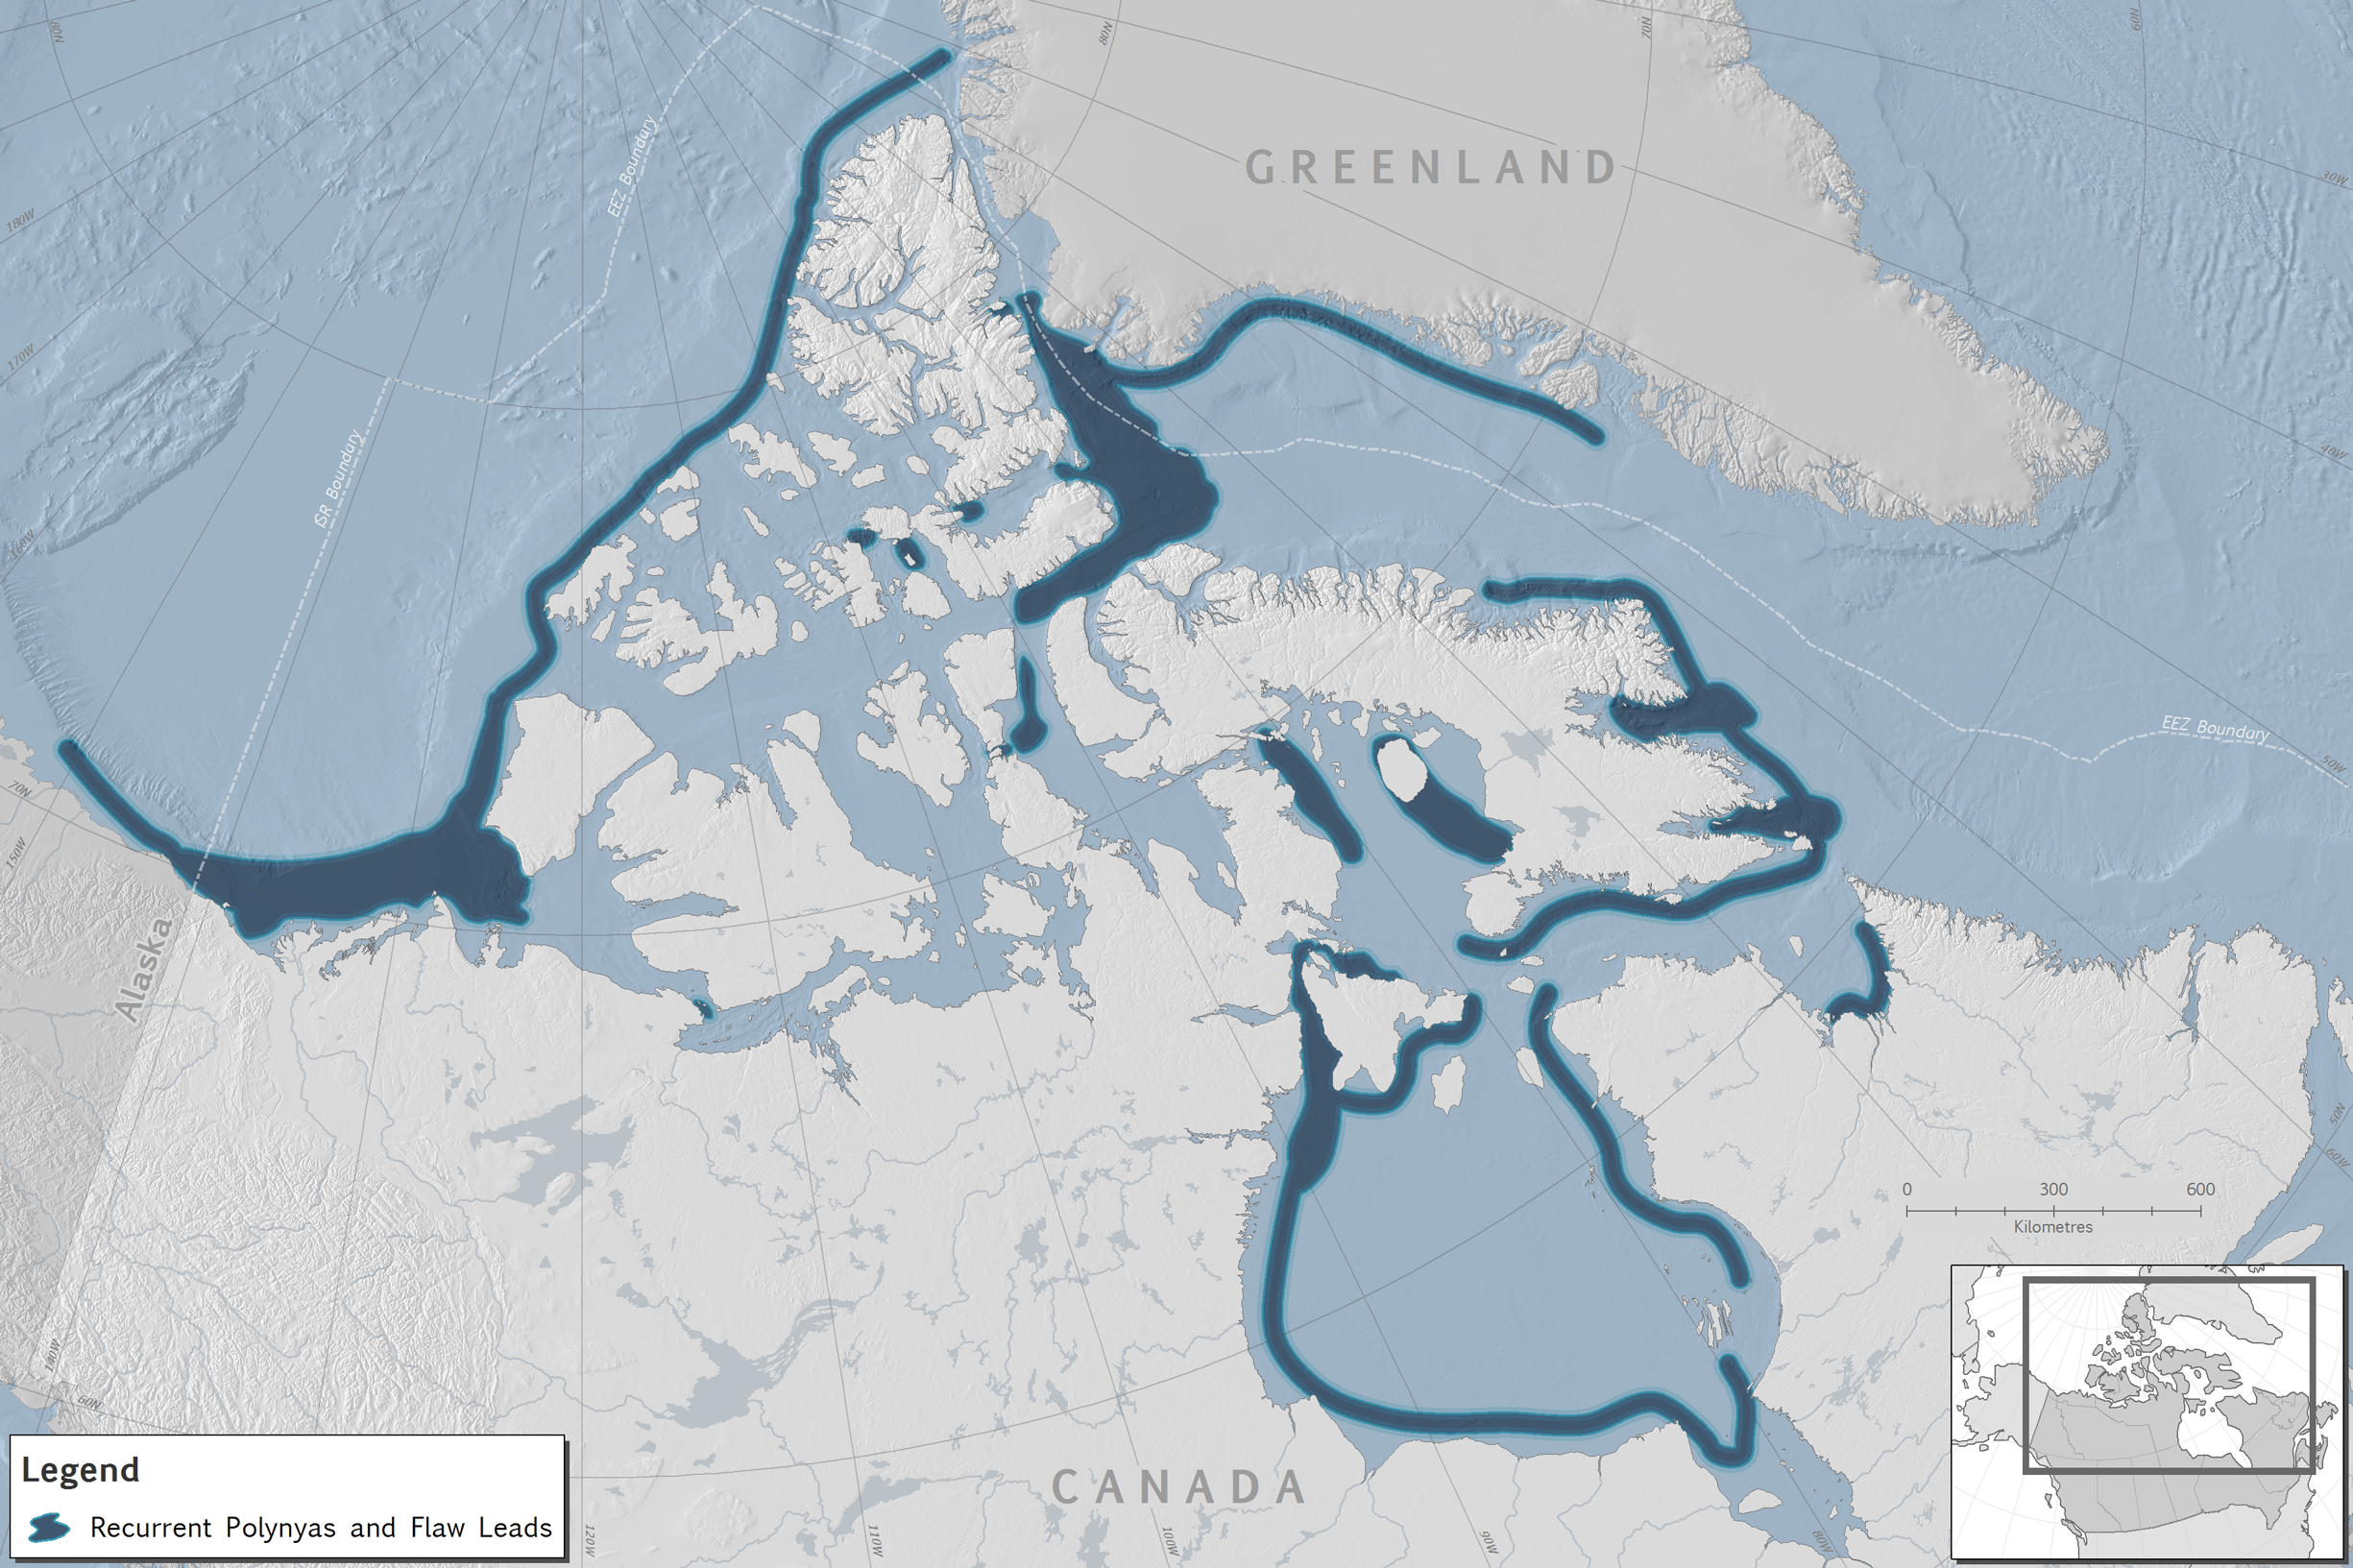
On the polynya map, the polynya and flaw lead boundaries represent the synthesis of data from multiple publications, along with input from recognized experts on the oceanography of the Canadian Arctic. For detailed information on the data sources, see page 27 of the Arctic Marine Atlas.
These two maps demonstrate the important role that polynyas and flaw leads play in supporting Arctic ecosystems and phytoplankton growth. A changing climate impacts polynyas and flaw leads in different ways. In many cases, polynyas may open earlier or last longer as a result of climate change. Also, declining sea ice coverage has been correlated with greater phytoplankton blooms. However, climate change might also cause a polynya like Pikialasorsuaq, which depends on the formation of an ice bridge each year, to shrink or disappear.
Olivia Mussells is a special projects manager with Oceans North who has expertise in spatial analysis, data management and cartography.
Related Content
Satellite photo showing North Water Polynya in May 2020.
Credit: Oceans North
Climate Change Affects Sea Ice Formation in North Water Polynya
Credit: Oceans North
How Mapping Arctic Sea Ice Helps Monitor Climate Change
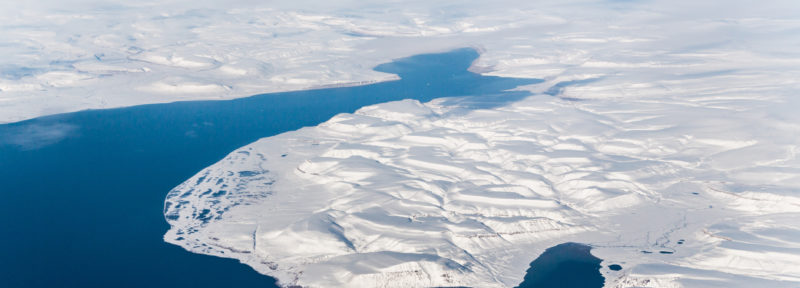
Aerial view over Baffin Bay.
Credit: Gfed
How We Can Limit Fishing North of 72°N