Northern Latitudes: Mapping the North Water Polynya
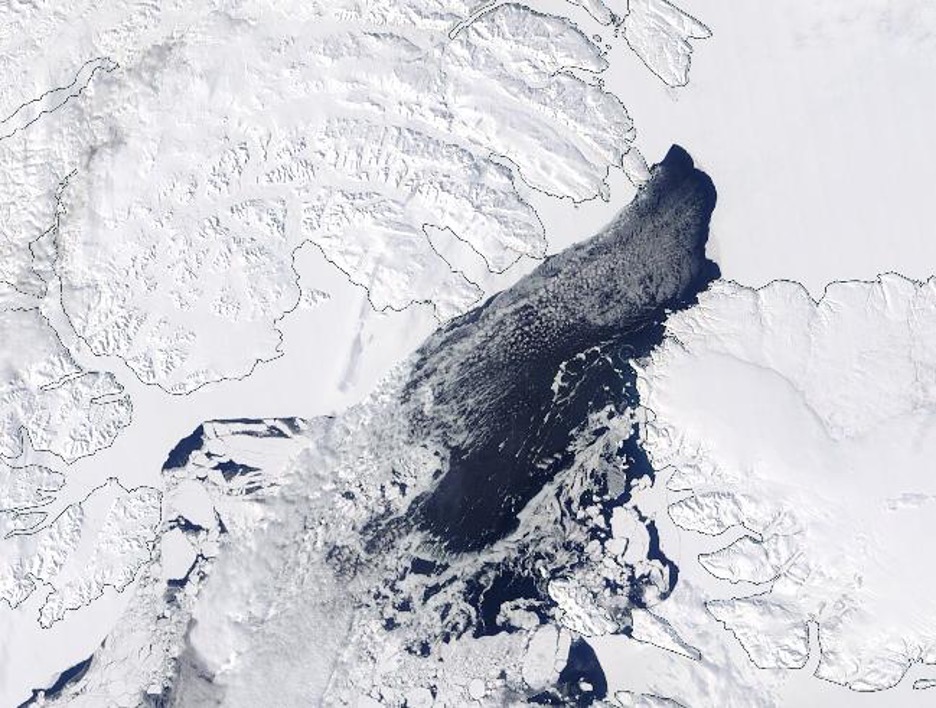
A snapshot of the polynya on May 8, 2024, per NASA Worldview.
ᐃᓕᓴᕆᔭᐅᔪᖅ: Terra/MODIS
Northern Latitudes is a series examining how maps and mapmaking contribute to our work. This is a Q & A with Melissa Turner, marine geographer for Oceans North, about how and why mapping is used to track climate-related changes in the North Water polynya, also known as Pikialasorsuaq in Greenland, and Sarvarjuaq in Nunavut.
Q: Why is mapping a useful tool to help scientists and others monitor climate-related changes in the North Water polynya?
A: Mapping enables scientists to capture and analyze both long-term and short-term dynamic changes in the North Water polynya, a vibrant and ever-changing marine environment. Even simple exercises, such as observing a timelapse of the polynya’s annual cycle, can reveal an almost living, breathing body of water. Mapping can detect when the ice bridge at Nares Strait forms each winter and when it breaks down in the spring, as well as other ice dynamics in the polynya. It is useful in tracking the extent of open water areas in the polynya, the age and movement of sea ice, the influence of tidal fluctuations on open water, and how climate change is affecting this marine environment.
Q: What mapping tools are available and how do they work?
A: To track changes in the North Water polynya, a variety of remote sensing tools are used that capture images and data from satellites, airplanes, and buoys.
These tools help us see how the ice and water change over time. For example, The Canadian Space Agency RADARSAT-1 satellite uses synthetic aperture radar (SAR) technology to provide high-resolution, all-weather, day-and-night images, further aiding in the monitoring of sea ice dynamics and environmental changes in the polynya. The European Space Agency’s Sentinel-1 satellite utilizes the same SAR technology.
The Advanced Very High Resolution Radiometer (AVHRR) on NOAA’s polar-orbiting satellites captures thermal images using both visible and infrared light. These images are used to monitor sea and ice surface temperatures, which help track the extent and conditions of the polynya. AVHRR data is particularly valuable for detecting changes in ice cover and understanding the thermal dynamics of the region.

Timelapse of the polynya from April 5 to May 14 from NASA Worldview. Source: Terra/MODIS
Programs such as NASA’s EOSDIS (Earth Observing System Data and Information System provide comprehensive access to the most up-to-date high-resolution images of our planet. NASA’s Worldview is an online map interactive tool anyone can access to see near real-time images of the polynya, including when the ice forms and melts each year. Below is an image captured from the MODIS instrument aboard the Earth Observing System Terra Satellite. This satellite turns its gaze to the North Water polynya typically in the late winter and early spring months each year.
Prediction models use data from these sources, along with wind speed measurements from weather satellites and buoys, to forecast changes in the polynya. For example, the integration of the ESA’s CryoSat data and other satellite data (like Sentinel-1 and MODIS) and in-situ measurements (such as drifting buoys) provide a more comprehensive picture of the polynya’s behaviour. This integration enhances accuracy and detail of this complex environment.
The NSIDC Sea Ice Index, derived from satellite measurements using instruments like the SSM/I and AMSR-E, provides crucial daily and monthly summaries of sea ice extent and concentration, which are used alongside data from tools like RADARSAT-1, Sentinel-1, AVHRR, CryoSat, and MODIS to enhance the monitoring and prediction models of the North Water Polynya.
The mapping tools and studies mentioned above represent some of the key remote sensing technologies used to map and monitor the North Water Polynya. However, this list is not exhaustive. Numerous other tools and methods are employed by scientists and researchers worldwide to study this dynamic and vital region. The combination of various remote sensing technologies and in-situ measurements continues to enhance our understanding of the polynya’s behavior and the impacts of climate change on Arctic environments.
Q: How is this information useful to local communities?
A: Local communities in northern Baffin Bay and neighboring communities in Greenland can benefit in numerous ways from this data and the maps made by those who study the area. Maps can monitor where marine mammals and seabirds are located and the health of these populations. Mapping can also track changes in sea ice cover and water temperatures, information that is crucial for subsistence hunters and fishers in the region, and can be used to plan how to support local economies. The polynya holds cultural and ecological significance to Inuit, and understanding how it’s changing helps communities to plan for resource management in the future.
Traditional knowledge based on the observations of Inuit who live in this region also plays a role, and sometimes surpasses, the data provided by satellites. Both sources of information are valuable in monitoring changes in the polynya.
Q: What recent trends has mapping revealed in the North Water?
A: Over the last decade, the open water area of the polynya has increased both in size and how longs it lasts. This is due to ice forming later in the autumn and breaking up sooner in the spring, as a result of rising temperatures and changing wind patterns.
Another trend is that the ice bridge at Nares Strait, a crucial factor in the formation of the polynya, is less stable than in the past and has even failed to form some years. The ice arch failed to form for the first time in 2007, as well as in 2009, 2010, 2017 and 2019. As a result, multiyear ice has been lost from the Arctic through Nares Strait.
These trends in ice cover and open water are significant because they have implications for the marine ecosystem, including the distribution and abundance of wildlife, and can affect the entire food web.
Mapping the polynya is an important tool in understanding and predicting how climate change will affect this important marine ecosystem.
Ruth Teichroeb is a regular contributor to Oceans North and is former communications director. She is based in Sidney, B.C.
Related Content
ᐃᒪᕐᒥᐅᑕᓂᑦ ᖃᐅᔨᓴᖅᑎ ᑯᕆᔅᑎᓐ ᐅᐊᔅᑕᓪ, ᑕᕆᐅᕐᔪᐊᓕᕆᔨᒃᑯᑦ ᐅᑭᐅᖅᑕᖅᑐᒥ, ᐃᖏᕐᕋᕗᖅ ᓯᑯᒥ ᐊᐅᓐᓂᑯᒥ ᑕᓯᕋᓛᒥ, ᒥᑦᑎᒪᑕᓕᖕᒥ, ᓄᓇᕗᑦ.
ᐃᓕᓴᕆᔭᐅᔪᖅ: ᑯᕆᔅᑎᓐ ᐅᐊᔅᑕᓪ
ᐅᑭᐅᖅᑕᖅᑐᒥ ᖃᐅᔨᓴᐃᓂᖅ ᐊᒻᒪ ᓄᓇᖃᖅᑳᖅᓯᒪᔪᑦ ᖃᐅᔨᒪᓂᖏᑦ
ᐃᑭᐊᖅᑭᕕᐅᑉ ᐱᒋᐊᕐᕕᖓᓄᑦ ᐅᖃᐅᓯᒃᓴᑦ: ᐱᑕᖃᐃᓐᓇᑎᑦᑎᓂᕐᒧᑦ ᐅᑭᐅᖅᑕᖅᑐᒥ ᐱᐅᖅᓱᐊᕐᓂᕐᒧᑦ ᐱᔾᔪᑎᖃᓲᖑᕗᖅ ᐱᐅᓂᖅᐹᓂ ᑐᑭᓯᒋᐊᕈᑎᓂ ᐃᑲᔪᖅᓱᕈᒪᔪᑦ ᖃᓄᐃᙱᑦᑎᐊᖅᑐᒥ ᐃᒪᕐᒥᐅᑕᓂᑦ ᐊᕙᑎᒥ ᐊᒻᒪ ᐃᖏᕐᕋᑦᑎᐊᖅᑐᓂ ᐅᑭᐅᖅᑕᖅᑐᒥ ᓄᓇᓕᖕᓂ.
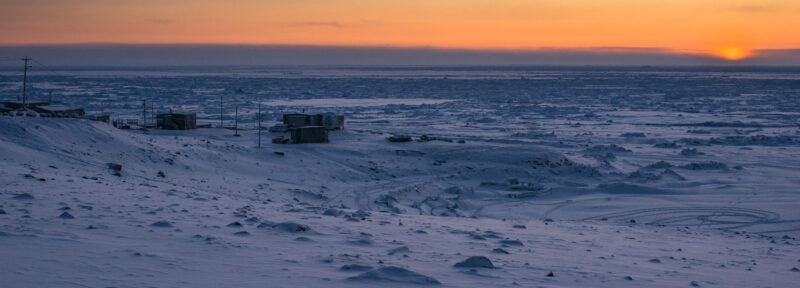
The first sunrise of the new year in Grise Fiord.
ᐃᓕᓴᕆᔭᐅᔪᖅ: Adobe Stock
The Ice Bridge: Predicting the Future of the North Water Polynya
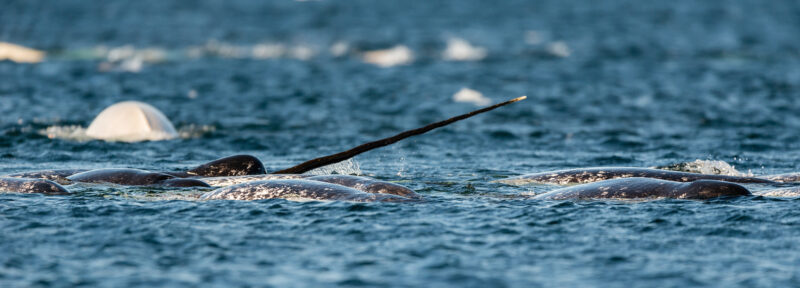
Narwhal breach the surface in the North Water. Narwhal, along with other marine mammals, use this area for calving, foraging, and migration.
ᐃᓕᓴᕆᔭᐅᔪᖅ: Adobe Stock
The Ice Bridge: A Hotspot of Marine Biodiversity in the Arctic
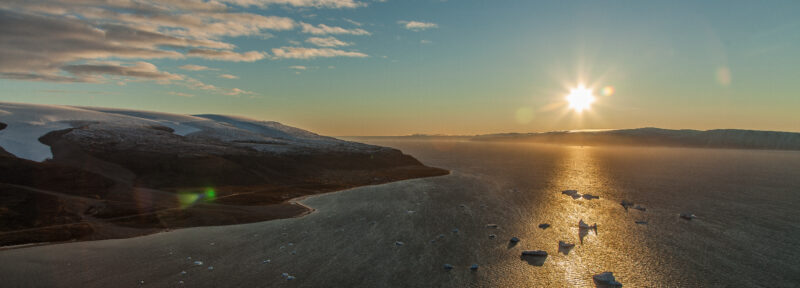
A sunrise in Qaanaaq, Greenland.
ᐃᓕᓴᕆᔭᐅᔪᖅ: Adobe Stock